GINVE.CLOUD
WebGis for trees and green spaces management
GINVE.CLOUD
WebGis for trees and green spaces management
What is GINVE.CLOUD
GINVE.CLOUD is a powerful and dedicated WebGis computerized management program for the urban green. It is nowadays used nationwide by over a hundred public authorities, numerous maintenance companies and an even growing number of professionals. GINVE.CLOUD provides the user with an extremely intuitive interface and a set of features specifically created to achieve a comprehensive and highly efficient management of the registered heritage such as public green (trees, shrubs, hedgerows, lawns), urban furniture (play equipment, benches, dustbins, fountains), irrigation systems or public lighting. GINVE.CLOUD deploys all functionalities required by the 10/2013 Law (Disposition on urban green spaces) and the new CAM 2020 law (M.D. 10/3/2020).
What you can do with GINVE.CLOUD
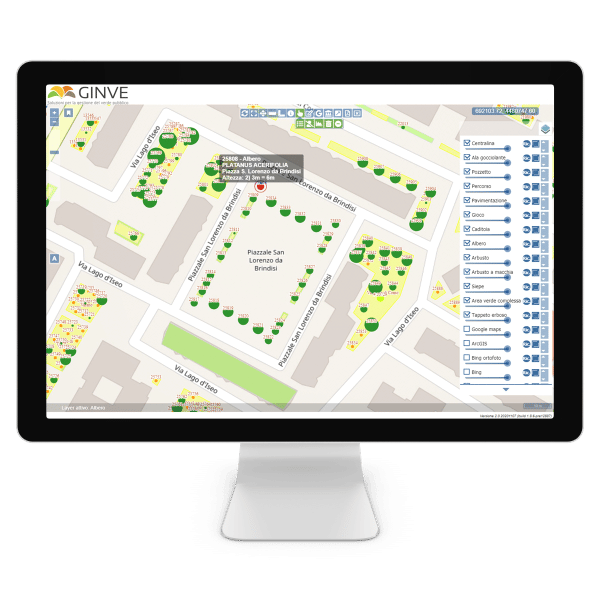
GINVE.CLOUD provides you with the exact consistency of the green spread on the territory and collect all useful information in a timely manner – for example, the number of trees within a specific green area, the height, the species, the characteristics, the dimensions, along with damages or interferences. GINVE.CLOUD software can monitor interventions and treatments performed and those scheduled on trees, as well as check the date and outcome of the last inspection. In addition to this, it skillfully steers all economic and human resources to grant people the highest standard of security and quality of green.
It is possible to export GINVE.CLOUD data - trees, lawns, or play equipment - in different formats (shape files, GeoJSON, KML, GML2, GML3, JSONP, CSV) along with the entire metric calculation (CSV) and then import, process, and managed them on other platforms.
Reporting green maintenance interventions
The maintenance reporting function of GINVE.CLOUD allows a real time view of maintenance status carried out by the maintenance teams.
Through GINVE.APP, each operator can manage work orders, send alerts, add new maintenance activities with GPS position, take one or more photos before and after carrying out each activity. Data are automatically transmitted to GINVE.CLOUD and can be managed thanks to the "reporting function".
Each maintenance activity carried out is represented on the intervention calendar, with a click it is possible to view the details of each activity and every related photo. Multiple filter functions are also available which allow users to quickly filter data.
Reporting green spaces maintenance interventions
The maintenance reporting function of GINVE.CLOUD allows a real time view of maintenance status carried out by the maintenance teams.
Through GINVE.APP, each operator can manage work orders, send alerts, add new maintenance activities with GPS position, take one or more photos before and after carrying out each activity. Data are automatically transmitted to GINVE.CLOUD and can be managed thanks to the "reporting function".
Each maintenance activity carried out is represented on the intervention calendar, with a click it is possible to view the details of each activity and every related photo. Multiple filter functions are also available which allow users to quickly filter data.
Risk analysis and stability assessment
GINVE.CLOUD integrates up to date tools for monitoring the safety and calculating the risk of trees.
Public and private green
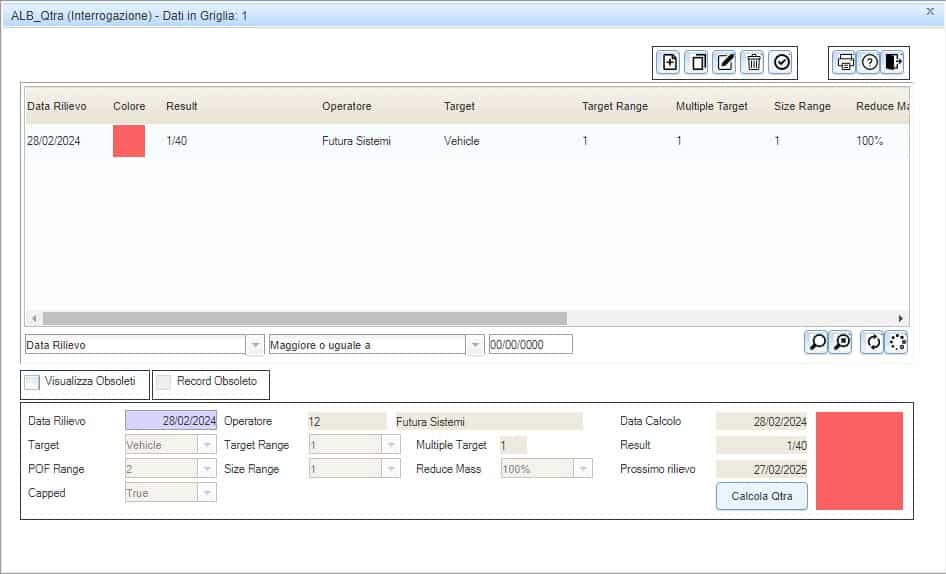
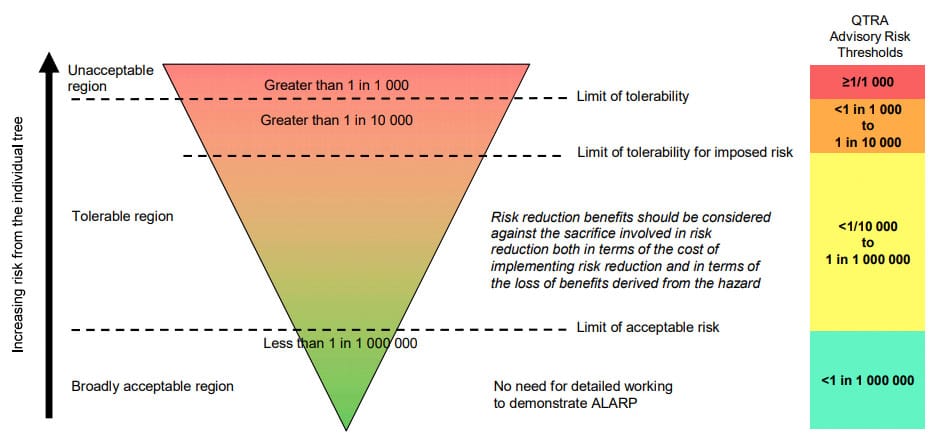
Thanks to the integration with the QTRA® platform (Quantified Tree Risk Assessment), it is possible to apply the fundamental principles of calculating the risk in the event of a tree crash to the management of tree safety. In this way, operators can balance safety with the values of the tree and intervene with predetermined limits of tolerance and acceptable risk recognized and applied internationally.
The information sent from GINVE.CLOUD to the QTRA platform takes place in real time and the result is displayed by assigning a color to the simulation and the probability that in the event of a fall, the tree will involve people, vehicles or buildings.
Zoos and amusement parks
GINVE.CLOUD allows you to manage the trees present in zoological gardens that can represent a direct and indirect danger to the public (for example the fall of a tree inside an enclosure of dangerous animals which could lead to their escape) . By assigning specific hazard indexes to the tree for people, animals or plants, it is possible to prioritize the interventions to be performed and targeted actions to minimize the risk of accidents.


Public spending under control
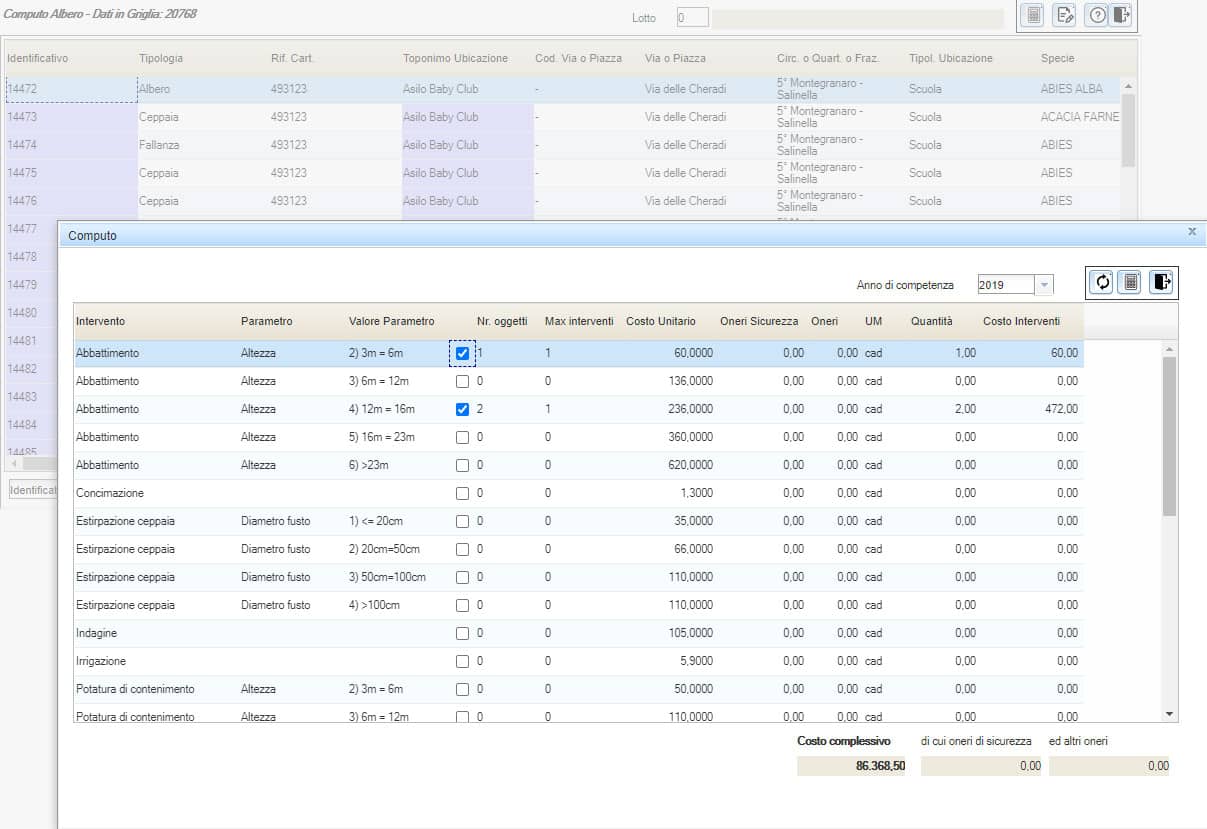
GINVE.CLOUD deploys the metric calculation function based on parameterized pricelist. It is possible to either calculate the cost for the current year or select a specific year and visualize all past calculations to compare different periods. Thanks to the research filters it is also possible to limit the calculation to targeted parks or sites or trees bearing a specific risk class or cross all the above and more to other parameters at the same time.

Historic archive of urban green
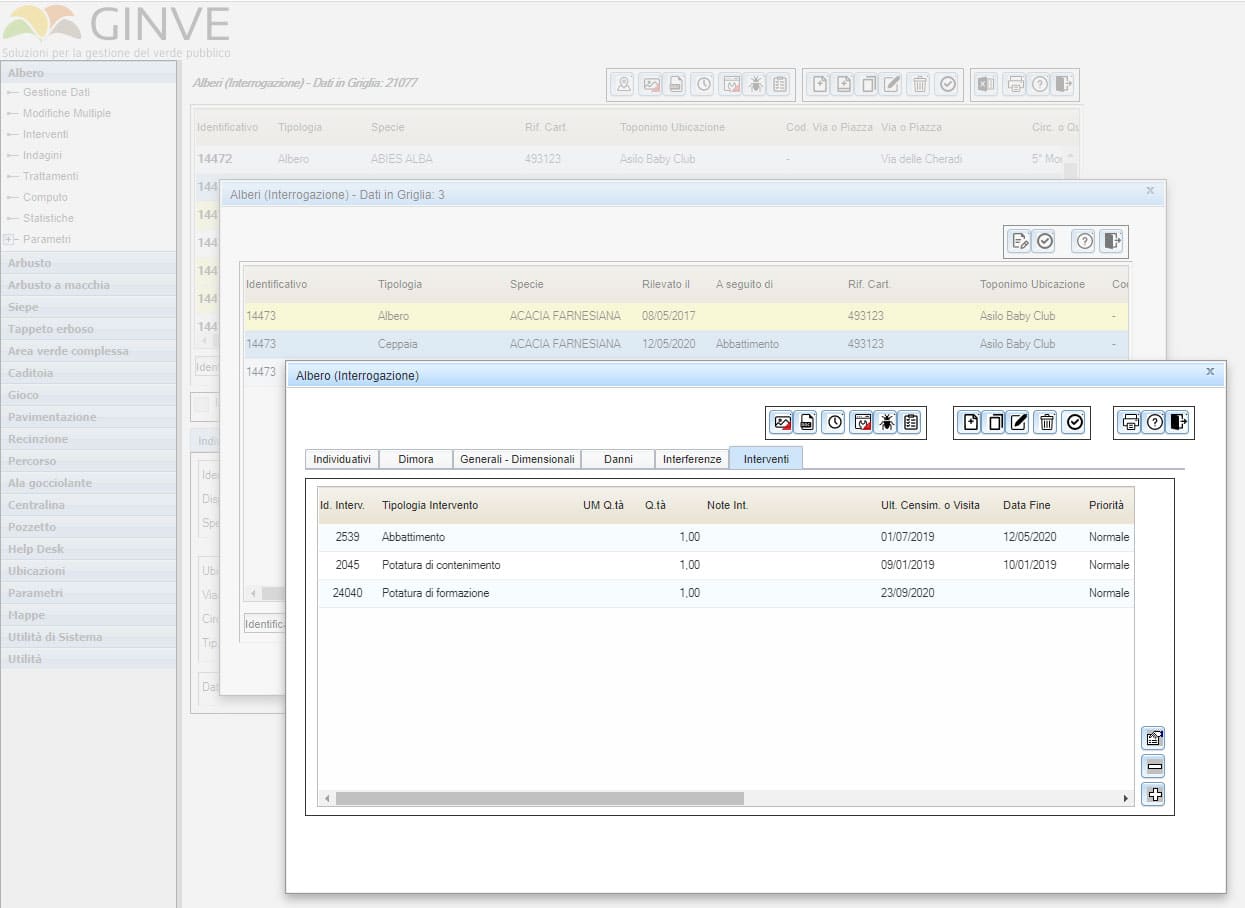
GINVE.CLOUD automatically updates the historic archive and enables to view the detailed history of the element selected at any time. History of data is a supporting tool for all public authorities to rely on:
- During decision making. According to the real need, it allows a fair analysis of the public spending
- During lawsuit. It allows to reduce the risk of liability in the event of accidents caused by trees, play equipment or other elements

Thematics and statistics
GINVE.CLOUD enables to create instant thematic queries using different shapes and colors to represent the elements selected on the map, i.e., the orange color for trees bearing a specific date of the latest inspection.
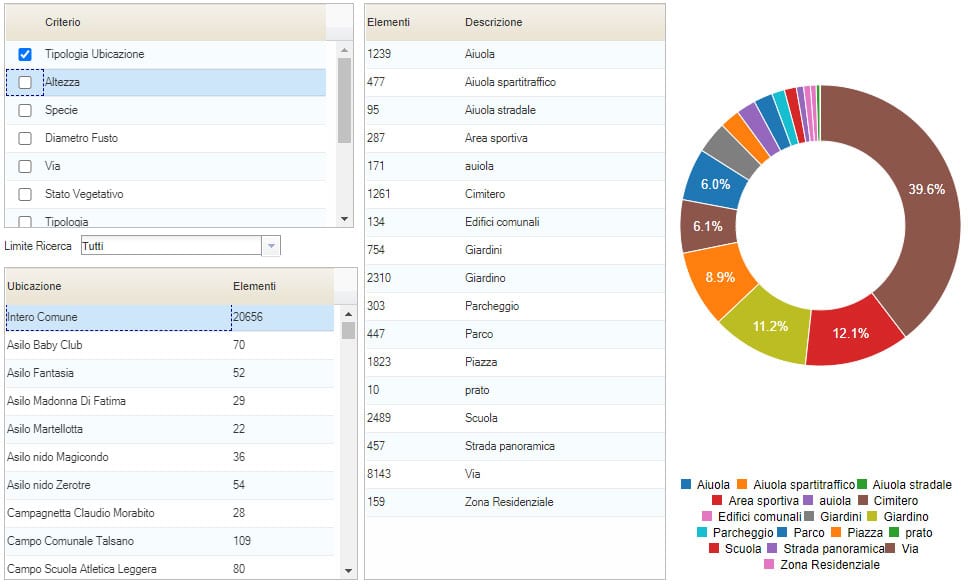
Thanks to the statistic function it is possible to generate real time graphics and get a quick view of green, urban furniture, and all the other elements managed by GINVE. Statistics can be done for the whole territory or specific sites.

Prints
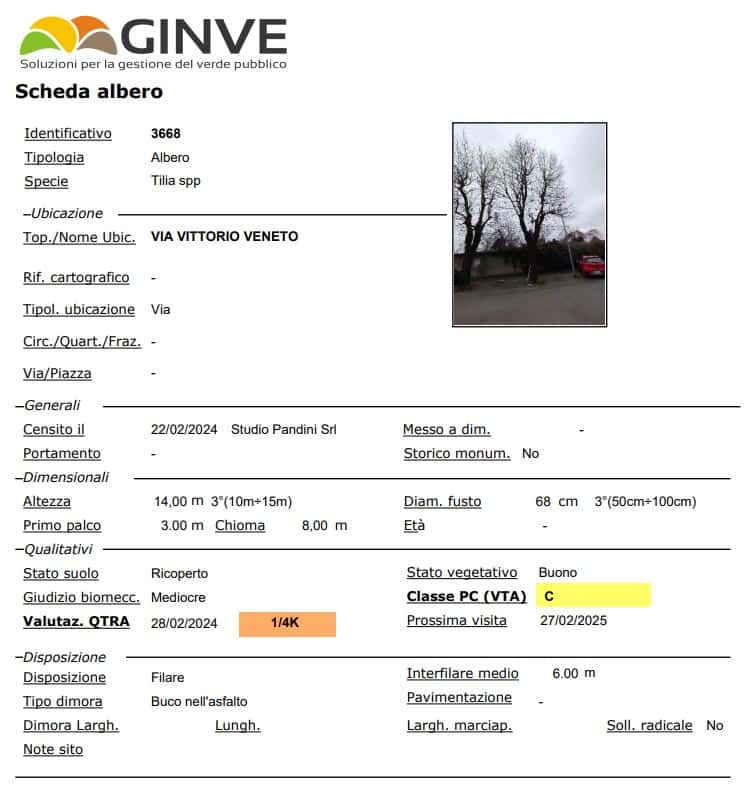
GINVE.CLOUD enables to print trees’ VTA worksheets and a general sheet of each element in PDF format and save them digitally or print on paper. Multiple printing allows to generate a single pdf file enlisting all sheets of the trees selected in a matter of seconds. All prints can be customized according to different requests. The printing map option enables to produce the pdf file of the map in a A5 format up to A0 format and select the dpis for the printing and the required position of the paper.

QR Code management and printing
QR Code management allows the printing of QR codes to be physically applied to the managed elements. Just read the QR Code via any smartphone to instantly view the element data on your device. It is possible to print the QR Codes individually or select a range of identifiers or a location to proceed with a mass printing already paginated.


Fleet tracking and management
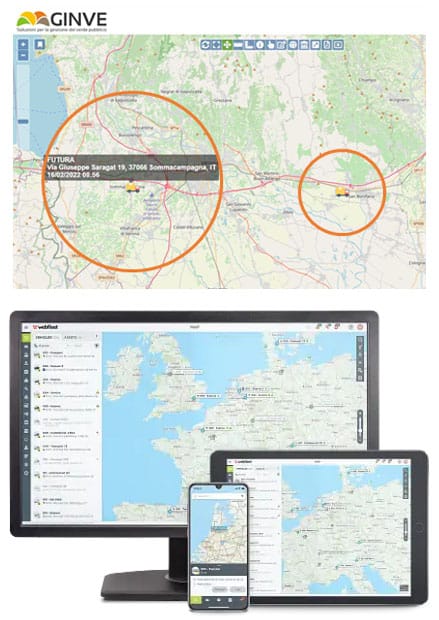
Thanks to the integration of Webfleet® services, a leading company in Europe in the detection, tracking and management of vehicle fleets, GINVE.CLOUD allows you to view the position of vehicles on a map, allowing users to immediately identify the areas where maintenance teams are working.
Just install a Webfleet LINK device on the vehicles by connecting it autonomously via the vehicle's OBD-II port (or CAN port from an authorized installer) to start receiving fleet information.
By accessing the Webfleet portal it is possible to monitor, in addition to the position, also the state of health of the vehicles, consumption and fuel level, malfunction data or diagnostic problems, access maintenance reminders and much more.
The use of Webfleet provides obvious benefits in terms of:
- GPS tracking and real-time tracking
- 20% savings on fuel and maintenance costs
- Easy integration with existing software and hardware
- Driving time reduction and route optimization
- Travel reporting, workforce management, sustainability and safety
- Improved service levels thanks to the optimized communication system with drivers

Integrated with i-Tree
We integrated i-Tree®, a software suite developed by the United States Forest Service (USFS) that provides tools for analysis and evaluation of the benefits of urban forests.
By integrating GINVE with i-Tree, we allow users to easily export data from GINVE to i-Tree and use it to obtain a detailed report on the ecological and economic benefits of the trees surveyed.
The integration of GINVE with i-Tree can also help communities better understand the value of managed public green spaces and help stakeholders make the correct maintenance decisions.
The report obtained from i-Tree provides detailed reports on the benefits of trees such as carbon storage, air pollution removal, and energy savings.

